

China Best Produce Trays Manufacturers for Global Buyers?
China has become a major sourcing destination for Produce Trays used in agriculture, food distribution, retail, and export packaging. Manufacturers offer molded pulp, PET, PP, and recycled plastic options for berries, tomatoes, mushrooms, peaches, and other delicate products. For global buyers, the real challenge is not finding a factory. It is verifying whether that factory can deliver stable quality, accurate dimensions, and dependable shipping.
A reliable supplier should explain material grades, tray weight, ventilation design, stacking strength, and production capacity. Product samples deserve close inspection. Check the tray edges, drainage holes, surface finish, and fit inside standard cartons. Small differences can affect bruising, cooling, and warehouse efficiency. Ask for food-contact documentation and applicable test reports. Requirements may differ between markets, so buyers should confirm them independently.
Factory experience matters, but it is not the whole story. Some manufacturers communicate quickly yet struggle with repeat orders. Others produce excellent samples but lack consistent quality control. This is where factory audits, inspection records, and reference checks become valuable. Pricing also needs context. A cheaper tray may create higher costs through breakage, poor stacking, or delayed delivery.
No supplier is perfect. Buyers should document acceptable tolerances and review risks before signing an agreement. The strongest partnerships combine practical product knowledge, transparent communication, and measurable quality standards. This guide examines China’s leading Produce Trays manufacturers and the factors global buyers should consider before choosing one.
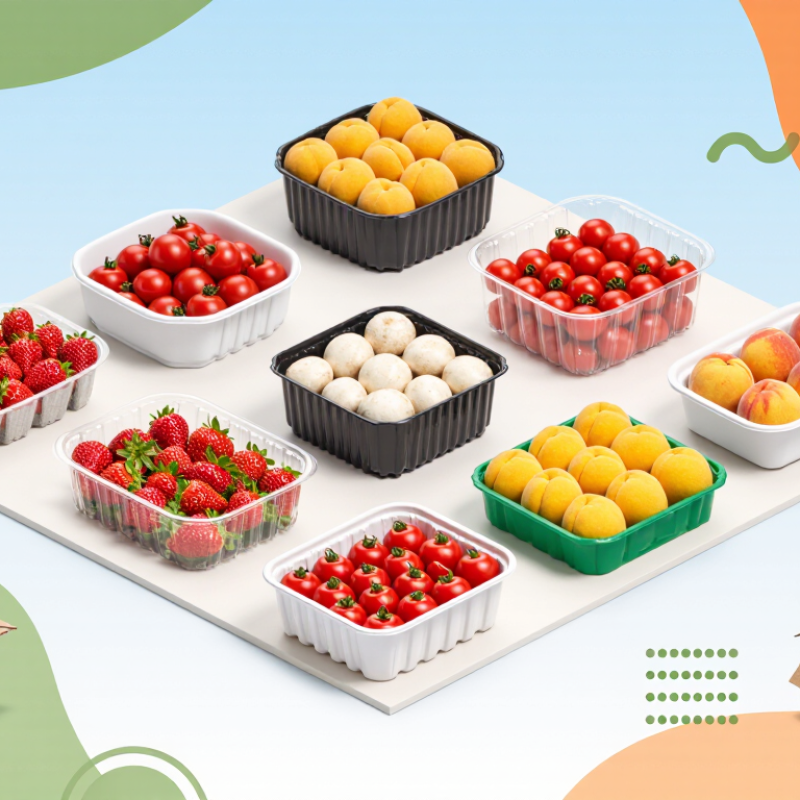
Define Buyer Needs: 13.2% of Food Is Lost Before Retail (FAO)
China Best Produce Trays Manufacturers for Global Buyers?
Define Buyer Needs: 13.2% of Food Is Lost Before Retail (FAO)
Food loss begins long before a customer sees a produce tray. FAO’s 2023 SDG Progress Report estimates that 13.2% of food was lost globally between harvest and retail in 2021. Fresh produce suffers quickly from bruising, compression, heat, and poor airflow. A tray is not just packaging. It is part of the loss-control system.
Global buyers should define the product before selecting a Chinese manufacturer. Leafy greens may need ventilation holes and shallow stacking. Soft berries need smooth edges and stable cavities. Heavy vegetables require stronger walls and tested load resistance. During sourcing, request compression tests, drop tests, material specifications, and samples from actual production. Small details matter.
Too much focus goes to price.
UNEP’s Food Waste Index Report 2024 recorded 1.05 billion tonnes of food waste in 2022 across households, foodservice, and retail. Its scope differs from FAO’s food-loss measurement, but the message is connected: packaging decisions influence the supply chain. Reusable or recyclable tray options may reduce impact, yet they can fail if cleaning, transport, or recovery systems are unavailable. Buyers should question assumptions, including their own. A cheaper tray can become expensive after one damaged shipment.
China Best Produce Trays Manufacturers for Global Buyers? - Define Buyer Needs: 13.2% of Food Is Lost Before Retail (FAO)
| Buyer Need | Relevant Produce Category | Recommended Tray Requirement | Data Point or Benchmark | Why It Matters Before Retail | Buyer Verification Method |
|---|---|---|---|---|---|
| Reduce supply-chain loss | All fresh produce | Use trays that protect produce from compression, abrasion, vibration, and impact during handling and transport. | 13.2% of food was lost globally between post-harvest and retail in 2021. | Packaging performance is one practical control point within the post-harvest chain. | Review compression, vibration, drop, and stacking test reports using the intended load and transport route. |
| Maintain cold-chain compatibility | Leafy greens, berries, broccoli, grapes | Select material and geometry that remain stable under refrigerated storage and condensation. | Many chilled fresh-produce operations target approximately 0–5°C, depending on crop and supply-chain specification. | Loss of stiffness or tray deformation can reduce ventilation and damage produce. | Conduct dimensional and load testing after refrigerated conditioning and condensation exposure. |
| Control moisture and condensation | Berries, mushrooms, cut vegetables | Provide drainage or absorbent-compatible features without blocking required airflow. | Excess free water accelerates quality deterioration and can increase microbial risk. | Moisture management helps preserve texture, appearance, and shelf life. | Evaluate water accumulation, pad compatibility, drainage performance, and product contact areas. |
| Enable ventilation and cooling | Leafy greens, herbs, berries, asparagus | Align vents with the tray pattern and pallet airflow path; avoid blocked openings after stacking. | Vent design must be validated for the specific crop, pack density, and cooling system; there is no single universal vent percentage. | Poor airflow can slow removal of field heat and create uneven temperatures. | Run forced-air cooling or airflow trials using the actual tray, product, and pallet pattern. |
| Prevent product bruising | Tomatoes, peaches, plums, avocados | Use smooth edges, stable cavities, controlled nesting, and adequate clearance for sensitive produce. | Tray geometry should be validated against the crop's size, firmness, maturity, and handling conditions. | Mechanical damage may not be visible at packing but can worsen before retail display. | Perform transit simulation and inspect bruising using a defined sampling plan and acceptance limit. |
| Meet food-contact requirements | Fresh and minimally processed produce | Use materials, inks, adhesives, and coatings suitable for the intended food-contact conditions. | EU Regulation (EC) No 1935/2004 and U.S. FDA food-contact rules are common regulatory references. | Compliance reduces the risk of chemical migration and market-entry delays. | Request a declaration of compliance, material specification, migration testing, and traceability records. |
| Optimize pallet and container utilization | Berries, grapes, tomatoes, packaged vegetables | Specify footprint, nesting, stack height, and carton compatibility before tooling approval. | Common pallet footprints include 1,200 × 800 mm and 1,200 × 1,000 mm, depending on market. | Better cube utilization can reduce empty space, handling, and transport emissions. | Confirm pallet pattern, load stability, gross weight, and compatibility with existing cartons and equipment. |
| Support retail-ready presentation | Berries, cherry tomatoes, mushrooms, premium fruit | Provide consistent dimensions, clean surfaces, high visibility, and stable display orientation. | Pack dimensions should be matched to the retailer's shelf, case, and display requirements. | A stable, attractive pack can reduce repacking and unnecessary handling at distribution centers. | Use a retail simulation to check shelf fit, label area, visibility, and display stability. |
| Improve traceability | All commercial produce shipments | Reserve a flat, scannable area for lot codes, harvest information, barcodes, or regulatory labels. | GS1 standards are widely used for identification and barcode data exchange. | Accurate identification supports targeted recalls instead of broad product disposal. | Test barcode readability after cold storage, condensation, abrasion, and normal handling. |
| Reduce packaging waste | All produce categories | Use the minimum material needed to achieve protection, hygiene, transport, and display performance. | The optimal material choice depends on local collection, sorting, recycling, and composting infrastructure. | A theoretically recyclable tray may not be recycled where the necessary system is unavailable. | Request material identification, bill of materials, recyclability or compostability evidence, and market-specific guidance. |
| Ensure consistent quality at scale | High-volume export programs | Define dimensional tolerances, weight limits, color requirements, and inspection procedures. | Critical-to-quality dimensions should be agreed in a signed product specification before mass production. | Variation can cause jams, unstable stacks, poor sealing, and inconsistent retail presentation. | Audit incoming inspection records, process controls, retained samples, and corrective-action procedures. |
| Control landed cost and supply risk | Global importers and distributors | Compare tooling, unit price, packing density, freight volume, minimum order quantity, and lead time. | Total cost of ownership includes product loss, transport cube, duties, testing, tooling, and disposal costs—not only unit price. | A lower purchase price can be outweighed by damage, inefficient freight, or inconsistent supply. | Request a landed-cost model, production capacity evidence, lead-time commitments, and a documented contingency plan. |
Reference note: The 13.2% global food-loss figure refers to food lost between post-harvest and retail in 2021, as reported by the Food and Agriculture Organization of the United Nations (FAO) in the Food Loss Index reporting for SDG 12.3.1(a). Other requirements should be validated against the destination market, crop, handling system, and retailer specification.